
Zoho Analytics – Mobile BI
4.2star
215 reviews
50K+
Downloads

Everyone
info


About this app
View insightful visualizations on-the-go, enabled by this data visualization software.
This mobile business intelligence (BI) app complements the full web browser view offered by Zoho Analytics, the self-service BI and analytics software on the cloud. The app enables you to keep track of your key business metrics, spot trends early, collaborate with your colleagues, and arrive at informed business decisions, all on the go, enabling mobile BI analytics.
With this app, you can see all the data, reports and dashboards that you created and have in your Zoho Analytics account. You can interact with the reports, favorite those that you like or view very often, share them with your colleagues, clients and friends with fine-grained access control, and do much more.
The app allows you to analyze data and perform business data analytics, from a wide range of sources easily. It scales well and can crunch hundreds of millions of rows of data, creating analytics dashboards.
The below features make the Zoho Analytics app an indispensable mobile BI analytics and reporting tool, for any business user.
Key Features
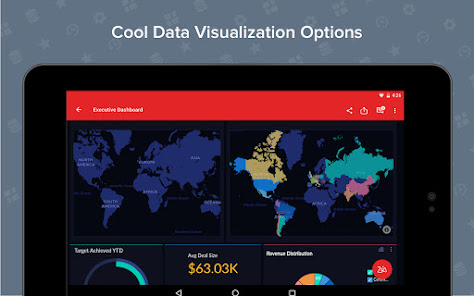
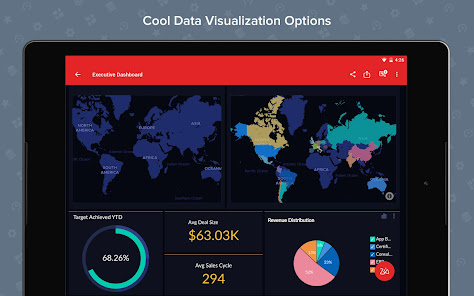
- Wide range of visualization options - geo-map, pie, donut, bar, stacked bar, line, bar-line combo, funnel, heat-map, web and a lot more chart types; Pivot tables, summary and tabular views.
- View single page, at-a-glance dashboards.
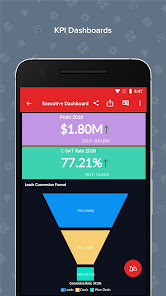
- Dashboards like KPI dashboards, business dashboards, marketing analytics dashboards, sales analytics dashboards and much more can be created with ease
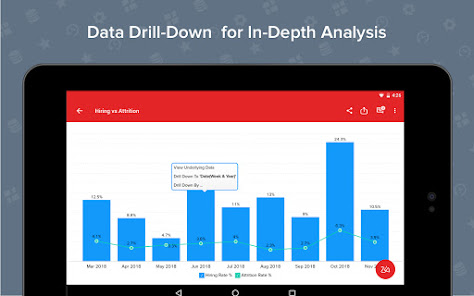
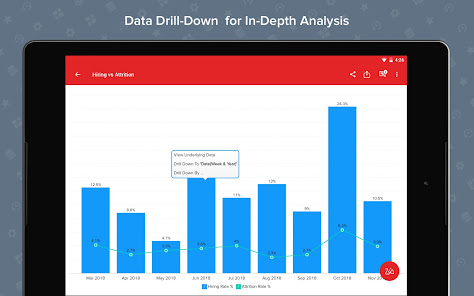
- Apply filters and see filtered data.
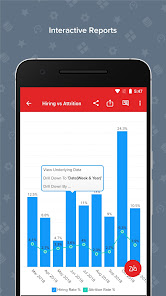
- See the underlying data, or drill-down any point in the report.
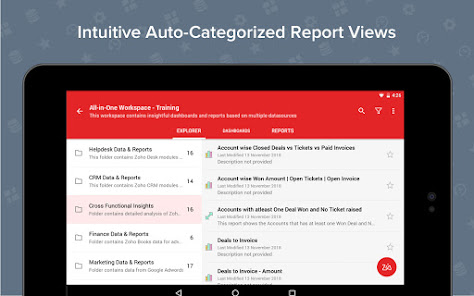
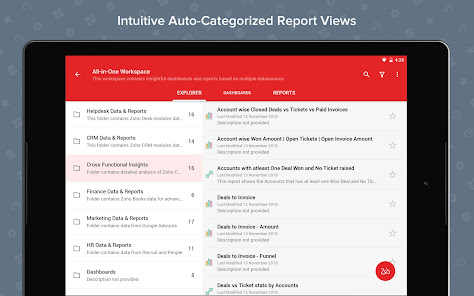
- Segregate reports based on type, folders and related views.
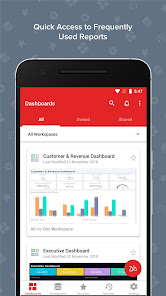
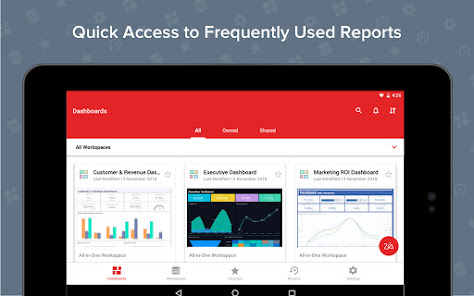
- Quickly access select reports using Favorites and Recent Items.
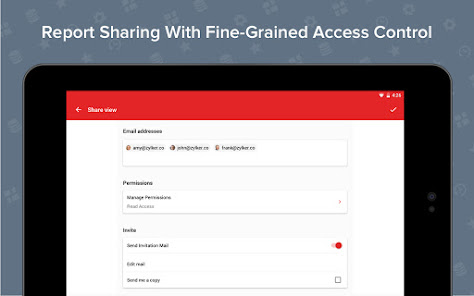
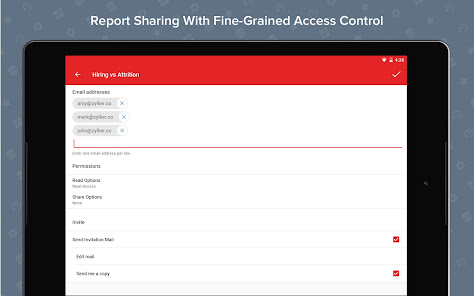
- Export and share your reports with your colleagues and clients, with fine-grained access control. You control what the shared user can or can't do, like create reports, view/drill-down the underlying data, export the data/reports, etc
This mobile business intelligence (BI) app complements the full web browser view offered by Zoho Analytics, the self-service BI and analytics software on the cloud. The app enables you to keep track of your key business metrics, spot trends early, collaborate with your colleagues, and arrive at informed business decisions, all on the go, enabling mobile BI analytics.
With this app, you can see all the data, reports and dashboards that you created and have in your Zoho Analytics account. You can interact with the reports, favorite those that you like or view very often, share them with your colleagues, clients and friends with fine-grained access control, and do much more.
The app allows you to analyze data and perform business data analytics, from a wide range of sources easily. It scales well and can crunch hundreds of millions of rows of data, creating analytics dashboards.
The below features make the Zoho Analytics app an indispensable mobile BI analytics and reporting tool, for any business user.
Key Features
- Wide range of visualization options - geo-map, pie, donut, bar, stacked bar, line, bar-line combo, funnel, heat-map, web and a lot more chart types; Pivot tables, summary and tabular views.
- View single page, at-a-glance dashboards.
- Dashboards like KPI dashboards, business dashboards, marketing analytics dashboards, sales analytics dashboards and much more can be created with ease
- Apply filters and see filtered data.
- See the underlying data, or drill-down any point in the report.
- Segregate reports based on type, folders and related views.
- Quickly access select reports using Favorites and Recent Items.
- Export and share your reports with your colleagues and clients, with fine-grained access control. You control what the shared user can or can't do, like create reports, view/drill-down the underlying data, export the data/reports, etc
Updated on
Safety starts with understanding how developers collect and share your data. Data privacy and security practices may vary based on your use, region, and age. The developer provided this information and may update it over time.

No data shared with third parties
Learn more about how developers declare sharing

This app may collect these data types
Personal info, App activity and 2 others

Data is encrypted in transit

You can request that data be deleted
Ratings and reviews
4.1
205 reviews

Chung Chuan
- Flag inappropriate
July 21, 2023
A bit slow sometimes to refresh. Everything works well and functional. However, the dashboards does not scale and display well with mobile screen, make sure you dont place charts left and right to each others. Also, some charts could just appear distortedly long. In short it is fully functional. Give it a 4 star rating because the web version is awesome with great data processing features and almost perfect charts , dashboard etc.
2 people found this review helpful

Eric Leapley
- Flag inappropriate
March 9, 2024
Useless on mobile, most reports are unable to be viewed due to lack of optimizing for a mobile screen.

A Google user
- Flag inappropriate
February 6, 2019
You can't create reports. You can't create views on your phone in the browser versions either because it's too buggy even though theoretically there's enough screen space. Good app if all you want to do is look at some reports but if you want more, don't bother.
16 people found this review helpful
What's new
Bug fixes


